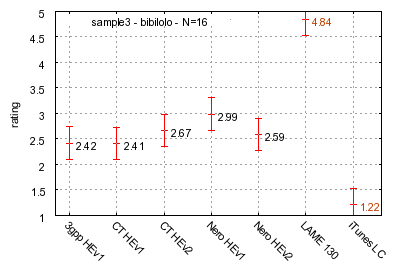
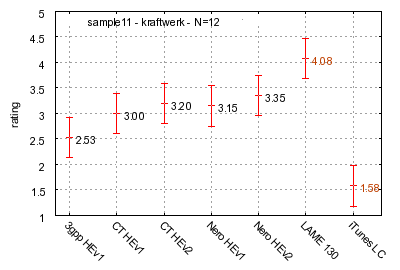
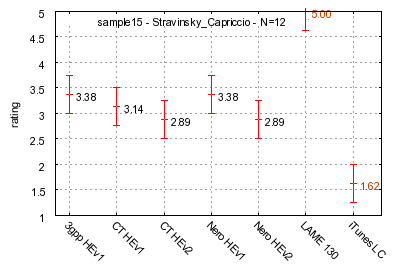
"experimental" modern music
results:
Bad result for CTv1 which is tied to the low anchor
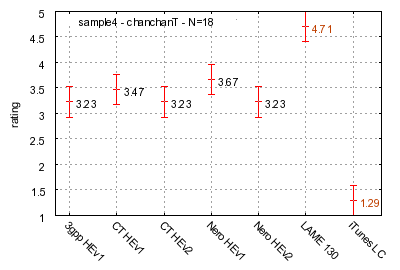
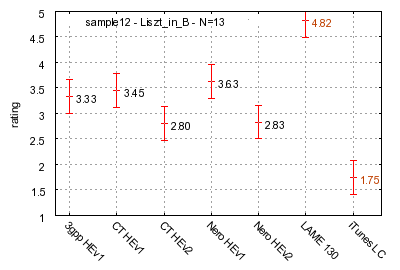
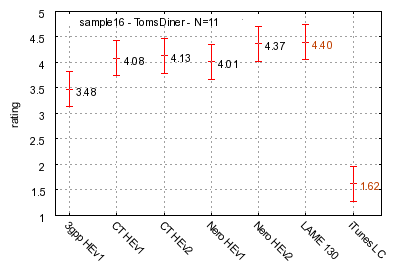
jazz
results:
All contenders (except anchors) are tied.
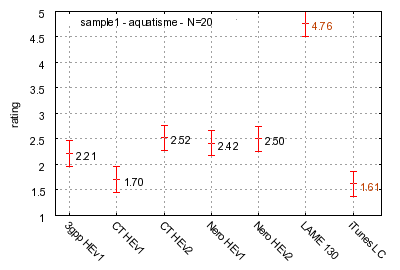
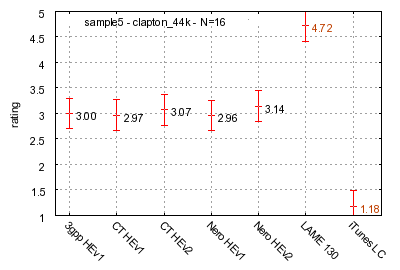
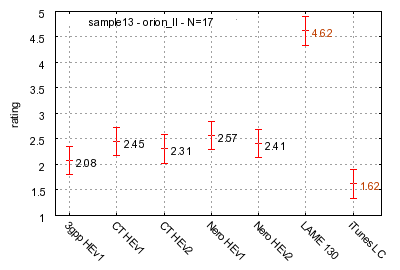
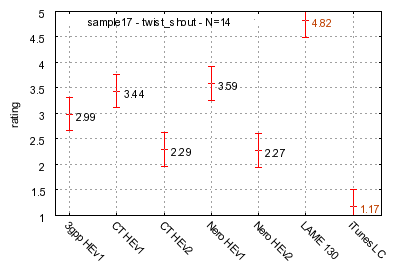
high pitched sounds
results:
On this sample the low anchor is clearly remove parts of the sound, due to its lowpass.
Although it is statistaly tied to the other contenders, Nero v1 has a notation a little above others, probably because of its higher bitrate on this sample
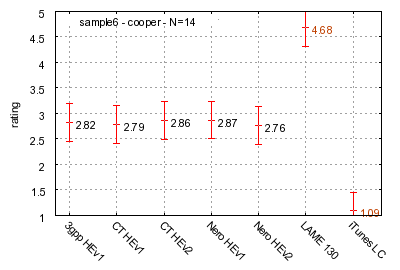
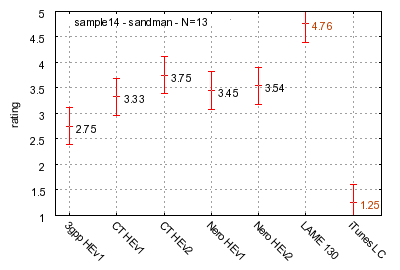
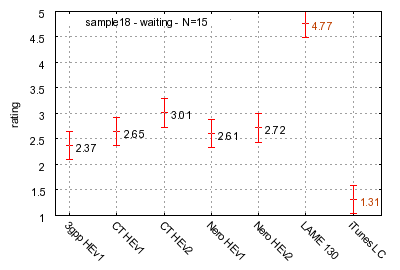
latin music, transcoded from MPEG Layer II
results:
All codecs (except anchors) are tied
acoustic guitar with applaudes
results:
All codecs (except anchors) are tied
male voice (singing) with music
results:
All codecs (except anchors) are tied
female and male spoken voice
results:
All codecs (except anchors) are tied
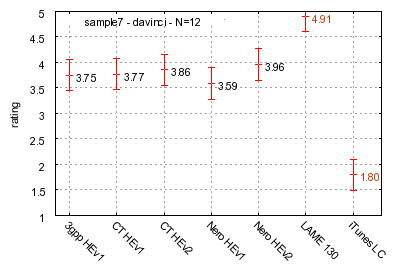
classical with vocals
results:
Good result of the HE-AACv1 contenders, which are tied to the high anchor, although they are only using 50% of its bitrate.
HE-AACv2 results are quite lower than v1 results.
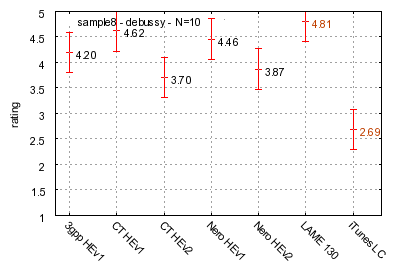
pop
results:
All codecs (except anchors) are tied
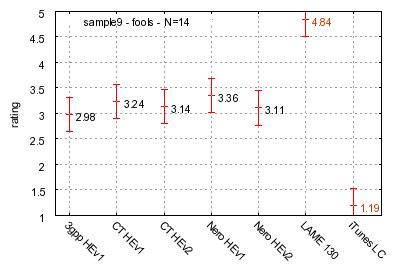
male voice with background music
results:
All codecs (except anchors) are tied
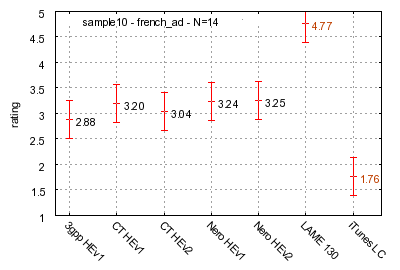
70's electronic
results:
Bad results of the high anchor (smeared transients). Lame, Nero v1 and v2, CT v2 are tied by a small margin.
piano
results:
On this sample Nero v1 is statistically better than Nero v2 and CT v2. It seems that parametric stereo is not at its best on this sample.
wind instrument
results:
Contenders are tied, but only 3gpp is tied to the low anchor.
hard rock
results:
Nero and CT encoders are sharing the first place, 3gpp is second.
violin
results:
All codecs (except anchors) are tied, but it seems that HE-AACv1 encoders are scoring better than v2 encoders.
a capella female voice
results:
Excellent results of the contenders. Except 3gpp, they are tied to the high anchor, despite using ony 50% of its bitrate.
3gpp, despite a respectable score, is beaten by Nero v2.
pop music with artificial stereo separation and yelling singer
results:
HE-AAC v1 contenders are clearly better than HE-AAC v2 ones.
rock
results:
All codecs (except anchors) are tied